The Economics of Renewable Energy: Corn Stover and Switchgrass
Introduction
Biomass is poised to become an important
energy source in the United States due to
concerns regarding oil imports and the
environment. Federal and state policies are
beginning to mandate the use of renewable
energy, some of which must come
from cellulosic sources. The development of
cellulosic bioenergy will require finding an
economically and environmentally sustainable
method for obtaining large quantities of
biomass feedstock (Biotechnology Industry
Organization, 2006). The primary objective
of this analysis is to determine up-to-date
cost estimates for the production, collection,
and transportation of corn stover and switchgrass
from Indiana farms of different sizes
that are located at various distances from an
electric utility plant or biofuels plant looking
to purchase biomass.
Biomass Production Cost
Analysis
In determining the costs for corn stover, three
collection scenarios are considered: baling a
windrow; raking and baling; and shredding,
raking, and baling. Each scenario removes
38, 52.5, and 70% of available stover on the
ground, respectively. With each increase in the
amount of stover that is removed, the field is
subject to more soil compaction, soil erosion,
and water erosion. Overall, different soils and
locations will need to be treated differently
with respect to how much stover can be safely
collected and removed. For each ton of stover
removed, additional nutrients are applied during
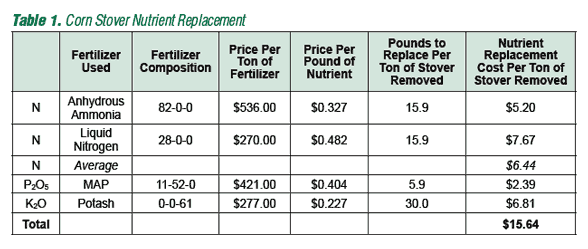
the annual fertilizer application. Table 1
outlines the per-ton cost of additional nitrogen,
phosphorus, and potassium.
One-time switchgrass establishment costs are amortized at an interest rate of 8% over the 10-year life of the stand. Field preparation includes mowing the field and spraying glyphosate to kill existing grasses. Production-year costs include those incurred during the maintenance and harvest of switchgrass. A land rent charge is added since switchgrass is a primary crop. Harvest and Transportation Cost Analysis Corn stover and switchgrass harvest with traditional hay equipment is either custom-hired or done with owned equipment. While new harvesting technologies that collect both corn grain and corn stover in one pass are being used on a trial basis, these technologies are not widespread and the use of hay equipment seems more appropriate for producers deciding to collect corn stover in the short run. Under the owned-equipment condition, an annual per-ton payment is calculated for farm sizes including 500 acres, 1,000 acres, 1,500 acres, and 2,000 acres. Total owned-equipment costs are based on the amortized equipment cost at 8% interest, fuel requirements, and labor requirements.
Baling options considered here are twine, net wrap, and plastic wrap. An associated dry-matter loss as a percentage of the total per-ton product cost is added to account for an assumed six months of on-the-ground storage at the edge of the field. For both corn stover and switchgrass, baling with net wrap is always the cheapest option. The slightly higher cost of net wrap is offset by a lower dry matter loss. Plastic wrap, however, costs nearly twice as much as net wrap, but the additional dry-matter loss savings is only about 2%. We assume that half of the bales would be used within six months, thereby not resulting in any loss for the farmer. The other half of the bales would need to be stored up to a year, thereby taking that land out of production. We added a premium for this production loss for half of the bales and averaged it for all bales. Each producer is paid a per-ton profit of 15% of the product cost to offer an additional incentive to producers to participate in biomass production.
The one-way distance from the field to the plant ranges from 5 and 50 miles and was calculated for intervals of 5 miles. As with harvest, transportation can be either custom-hired or owned, and the associated costs are calculated in the same manner. The average marginal transportation cost per mile is $0.20. Results
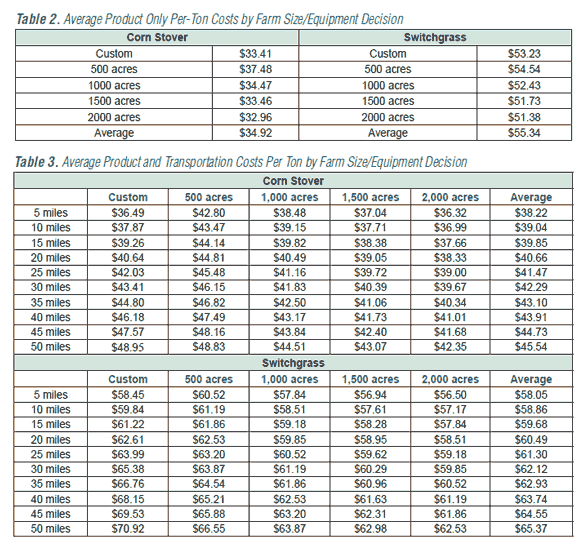
A set of cost averages serves as a preliminary benchmark for comparison and serves to highlight the differences in cost for various farm sizes and management decisions. Tables 2 and 3 outline these average costs for both corn stover and switchgrass. These averages include all removal rates and bale packaging options considered in this analysis for each farm size and equipment decision.
Biomass Supply and Demand
To apply these costs to the situation of a particular coal
power plant, supply curves are generated based on the
location of the plant and the available supply of biomass in
the area. Data for biomass supply is available from a recent
study by Oak Ridge National Laboratory sponsored by the
Department of Energy and the Department of Agriculture
that determines the total biomass availability for the United
States (Perlack, et al., 2005). Two land participation rates,
50% and 75%, are considered to allow only a fraction
of available supply to actually be brought to the plants.
Applying this supply data to a particular location is done
with a GIS software application called ArcMap. Figures 1,
2, and 3 show each plant location and the concentric supply
circles.
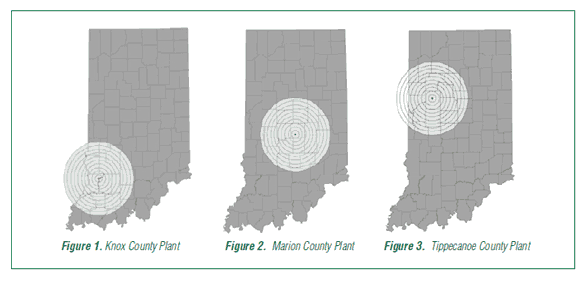
The Knox County plant in southern Indiana has a nearly nonexistant supply of corn stover, but a large supply of switchgrass. The Marion County plant is in a metropolitan area, which makes its overall supplies of biomass less abundant until the rural surrounding counties are reached. The Tippecanoe County plant is in a highly agricultural area and has large supplies of both corn stover and switchgrass. The amount of biomass demanded depends upon the size of each plant and the total heat production that is to come from biomass. For this analysis, biomass makes up from 1%-10% of total heat production. Information regarding the demand for fuel inputs from the coal plants comes from the Coal Power Plant Database by the National Energy Technology Laboratory (2005 data released in 2007) and the Environmental Protection Agency Clean Air Markets Data.
Supply curves for each biomass source are created for each plant by plotting the amount of biomass available at each distance against the cost of collection and transport of the given distance. The vertical lines on these graphs represent the possible fractions of total heat production from biomass. Where these vertical lines hit the x-axis, the amount of biomass required and the one-way distance from the plant to the furthest ton are indicated. At the point where the vertical line and the supply curve intersect, the associated value on the y-axis indicates the per-ton delivered cost for the furthest ton required. The area below the supply curve up to each vertical line indicates the total cost associated with acquiring the amount of biomass needed to generate a particular percentage of heat, assuming that the biomass and transportation costs are treated separately. Figure 4 is an example from the Knox County plant that shows a mix of biomass inputs and the general structure of the supply curves.
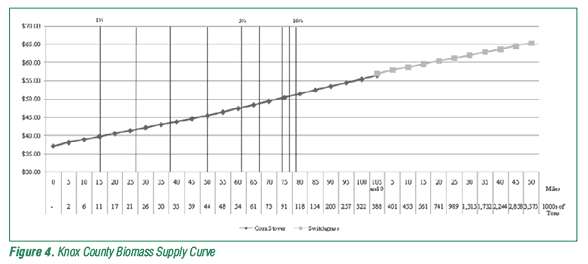
In this case, the plant uses corn stover up to 105 miles from the plant and then begins using switchgrass located near the plant. The Knox County plant will go approximately 80 miles from the plant to get corn stover for 10% of heat production and would only need to go approximately 15 miles from the plant to get switchgrass for 10% of heat production. However, the plant would likely use all corn stover despite the transportation distance, since it is less expensive than switchgrass. The Marion County plant is a larger plant and requires more biomass to meet requirements. For enough biomass to produce 10% of heat, the plant must go out between 35 and 45 miles. This increase in distance is accounted for by the proximity to a large metropolitan city and by the large size of the plant. The Tippecanoe County plant is small and located where both corn stover and switchgrass are abundant. Regardless of the type of biomass or the land participation rate, the plant could generate 10% of heat production from biomass grown less than 10 miles away.
Cost Comparisons: Coal to Biomass
This use of biomass in place of coal will reduce greenhouse
gas emissions. From Ney and Schnoor (2002) and
Spatari (2005), the net emission reductions in tons of CO2
equivalent from using one ton of biomass instead of coal
are 2.88 and 2.60 for corn stover and switchgrass, respectively.
In the case of switchgrass (but not for corn stover),
an indirect leakage effect occurs when land is shifted into
biomass production. This serves to negate a portion of the
CO2 sequestration from switchgrass. This analysis did not
take that effect into account, but the net CO2 reduction for
switchgrass may be lower as a result. Total CO2 emissions
for each plant are calculated by assuming that a ton of coal
generates 2.86 tons of CO2 when completely combusted
(Hong and Slatick, 1994).
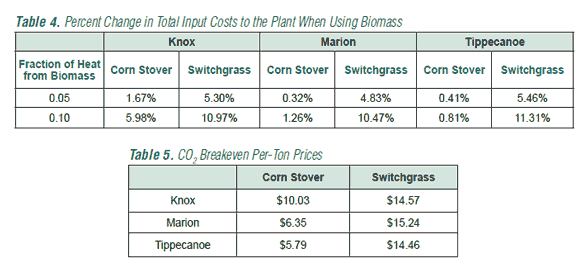
In Table 4, corn stover and switchgrass total input costs are compared to the cost of using coal. In nearly all cases, although use of biomass offsets some coal costs and CO2 emissions, it is not enough to offset the costs incurred from purchasing the biomass. Total input costs when biomass is used are calculated by adding together the savings from using less coal, the savings from reduced emissions, and the total amount spent on biomass.
Plants must determine how much additional cost they are willing to incur in order to incorporate biomass or “go green.” Table 5 provides breakeven-per-ton CO2 prices for situations where 10% of total heat production comes from biomass. Compared these to the current price from the Chicago Climate Exchange of $5.22 per ton of CO2. Breakeven prices for the use of corn stover are much lower than those for switchgrass due to the extra feedstock costs that must be covered in the case of switchgrass. These breakeven prices also signal the level of carbon tax that would be necessary to induce firms to use biomass as a substitute for coal under a carbon tax system.
Conclusions
Nutrient replacement and harvesting activities are the only
costs for collecting corn stover. This makes corn stover less
costly than switchgrass if transport distance is not considered.
Management decisions such as removal rate and
equipment decisions can also change corn stover per ton
costs. Total costs per dry ton for transporting corn stover
25 miles range between $39 and $45.
The input and activity costs that relate to switchgrass establishment, production, and harvest make it more expensive to use than corn stover. Total costs per dry ton for transporting switchgrass 25 miles range between $59 and $64. A recent study by Perrin, et al., determined switchgrass production costs on a commercial scale. The results were very similar to this analysis; however, yield and fertilizer assumptions varied.
Supply of biomass is far from uniform across the state of Indiana and the country as a whole, making plant location decisions very important. Variations in supply are affected by the proximity to metropolitan areas and the density of agriculture near the plant. However, because the delivered cost of switchgrass is higher than that of corn stover, plants will most likely choose to collect as much corn stover as possible at very far distances before they begin to collect any switchgrass.
The current resources of the individual producer are likely to dictate whether or not to pursue biomass production. Therefore, plant managers may face much uncertainty about the local supply. This uncertainty may lead plants to contract their supply of raw material before making any plant investment.
Future work on this topic should focus on finding ways to reduce the cost of producing and transporting biomass. Since both corn stover and switchgrass involve many inputs and activities for their production and transportation, large reductions in cost will be done by reducing the costs of numerous steps and components. Examples of ways to reduce cost might include further development of efficient corn stover harvesters or research to increase switchgrass yields. These results might also be used in exploring the potential for a cellulosic ethanol plant in Indiana and finding the optimal location for that plant. Based on the results of this analysis and assuming 60 gallons of ethanol can be produced from one ton of biomass, Indiana corn stover could produce between 100 to 150 million gallons of ethanol annually, and Indiana switchgrass could produce between 160 to 240 million gallons of ethanol annually, depending upon the land participation rate. These projections are based on current conditions in the state and could be larger should land use and tillage changes be adopted.
by Sarah Brechbill and Wallace E. Tyner - Purdue University
This article hasn't been commented yet.


Write a comment
* = required field